Introduction
The electrical activity of the human brain has always felt a little magical to me. It is one of those topics that sounds almost science-fiction at first, but once you start digging into it, you realize it is surprisingly practical and very hands-on. In this project, I tried to build a simple brain-computer interface by amplifying and filtering brain signals, sending them to a data acquisition board, and then working with them in LabVIEW.
The basic idea was simple enough: if brain activity has recognizable patterns, then those patterns might be used to trigger something useful. In practice, that turned out to be a lot trickier than it sounds, but it was exactly the kind of challenge I enjoy. The goal was to isolate different frequency bands and see whether they could be interpreted well enough to control a small output.
This project was meant to be a lightweight version of the NeuroSky approach, using the frontal cortex and the region around the ears as reference points. The idea was to look at how different brainwave frequencies relate to different mental states and then use that information to build a basic control system.
Physiology of the Human Brain
The human brain is a complicated machine, but it can be broken down into a few major regions that help make sense of what is going on. The frontal, parietal, occipital, and temporal lobes each have their own role, and for this project I focused on the frontal lobe because it is a natural place to look for signals related to attention, movement, and decision-making.
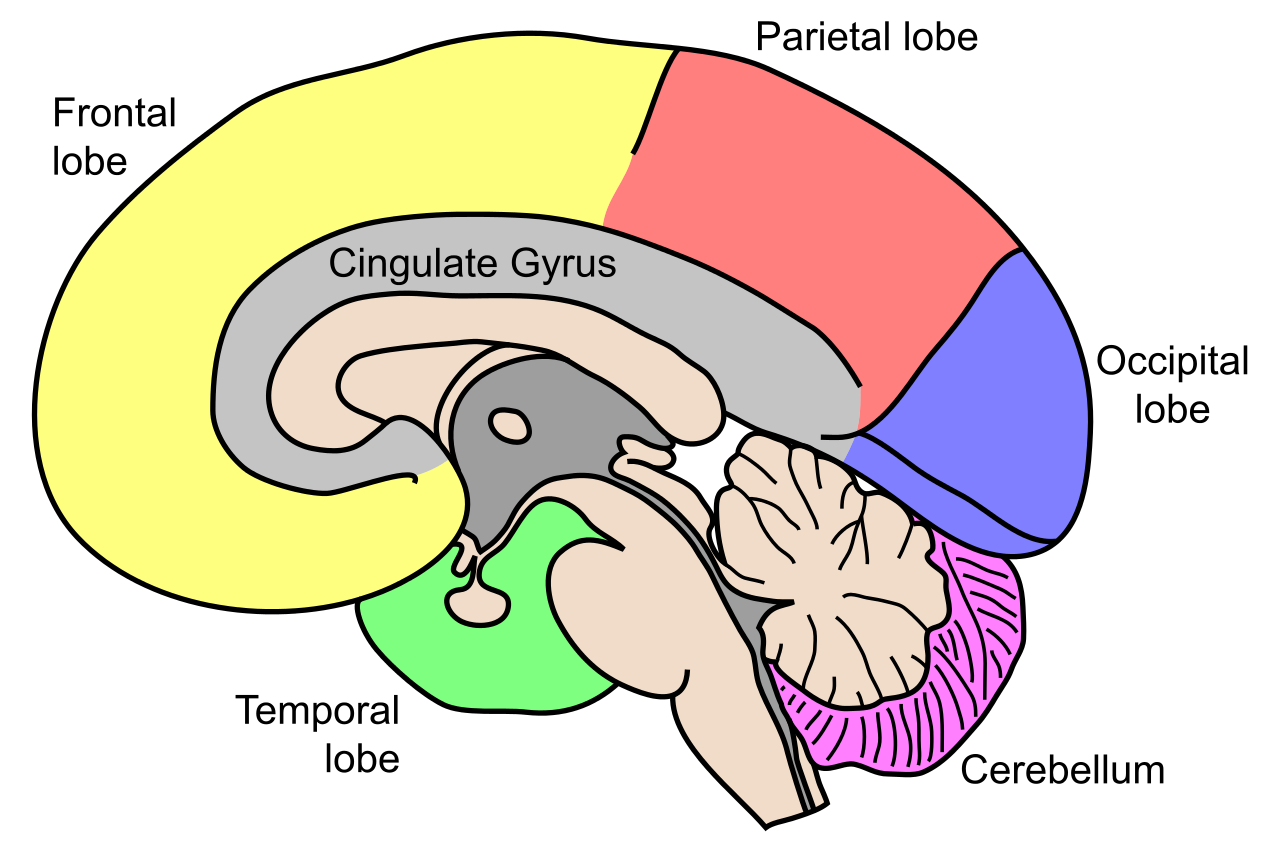
Parts of the human brain
Different brainwave frequencies are tied to different mental states, and that is what makes the whole thing interesting. Delta, theta, alpha, and beta waves each show up under different conditions, from deep relaxation to active focus. The table below summarizes the ranges I was working with.
- Delta waves can show up in situations linked to brain injury or unusual states, especially in certain age groups.
- Theta waves tend to appear when the mind is under emotional strain or under a lot of mental load.
- Alpha waves are commonly associated with calm, relaxed states.
- Beta waves are more linked to alertness and active thinking.
There are other frequencies too, but for this project the four above were the most relevant. The main thing that separates them is the frequency range in which they appear.
| Wave | Frequencies (Hz) |
|---|---|
| Delta | 0.4 to 4 |
| Theta | 4 to 8 |
| Alfa | 8 to 13 |
| Beta | 13 to 30 |
Instrumentation
To make the system work, I needed the basic tools for measuring electrical signals from the brain. The final setup used the kind of instrumentation you would expect for an EEG experiment, and the block diagram below gives a good overview of how the pieces fit together.
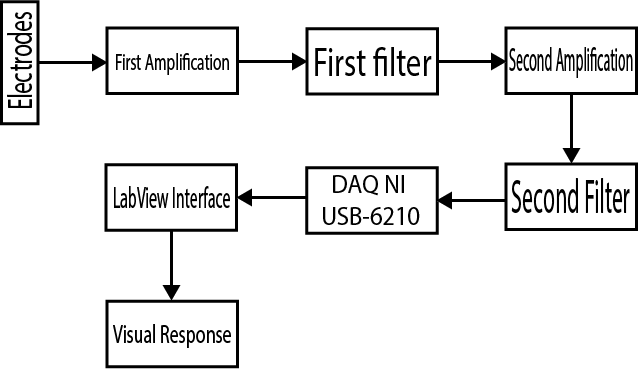
Block diagram of the circuitry
The electrodes were the same kind of simple wet electrodes often used in ECG work. They had the usual soft backing, conductive gel, and adhesive, which made them practical for a small experimental setup.
To connect the brain to the computer, I used a circuit that provided a single EEG channel. The design came from Bernd Porr, and it was a useful starting point for getting a clean enough signal to work with.
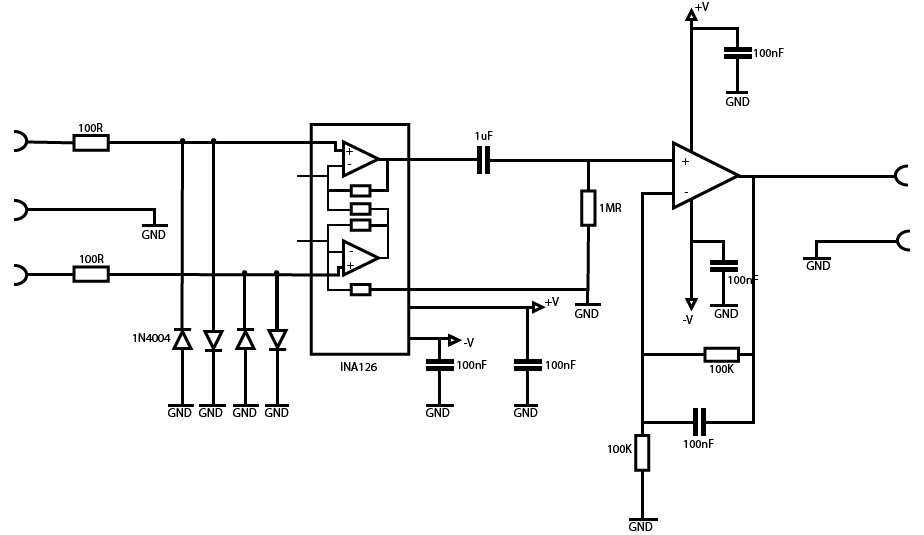
Biosignals amplification circuit
The circuit itself was fairly simple in concept. It used an instrumentation amplifier for the first stage, which helped keep the signal clean and stable, and then a second amplification stage to make the signal easier to work with. Between those stages there was a high-pass filter to reduce unwanted interference, and after that a 60 Hz notch filter to cut out the electrical noise from the mains line.
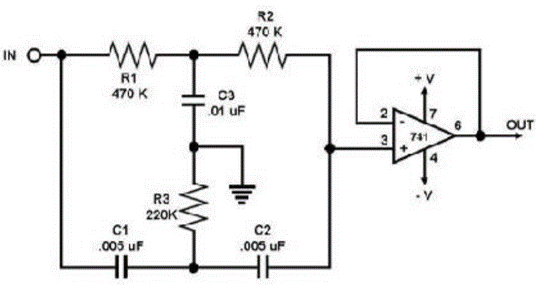
Notch Filter
The data acquisition board was a National Instruments DAQ NI USB-6210, and it was responsible for reading the differential voltage from the circuit and sending that information to the computer.
LabView interface
LabVIEW is one of those tools that looks friendly at first and then suddenly turns into a deep rabbit hole. That said, it was very useful for this experiment because it let me visualize the raw signal and filter the signal bands in a fairly intuitive way. From there, I built a small algorithm that used the measured brainwave activity and the influence of blinking to drive an LED.
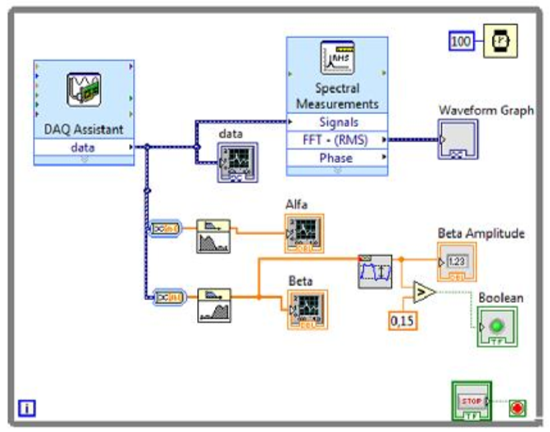
LabView code
The algorithm filtered the alpha and beta bands, measured their amplitudes, and compared them against a predefined threshold. That was enough to make a simple bit of information available. I was not able to recreate the more advanced mental-state recognition used by the NeuroSky headset, mainly because the hardware and software available were more limited than I needed, but the approach still worked well enough to demonstrate the basic idea.
What ended up being most noticeable was the effect of blinking. The eyes were interfering with the measurements in a very obvious way, and that gave me a practical way to generate a simple control signal. In the end, that was the feature I used to make the system respond.
Results
After a fair amount of testing and a lot of small fixes, the setup finally worked in the way I had hoped. To use it, the person would sit comfortably, the electrodes would be placed at the mastoids and at position Fp1 following the 10-20 system, and the whole thing would be started up.
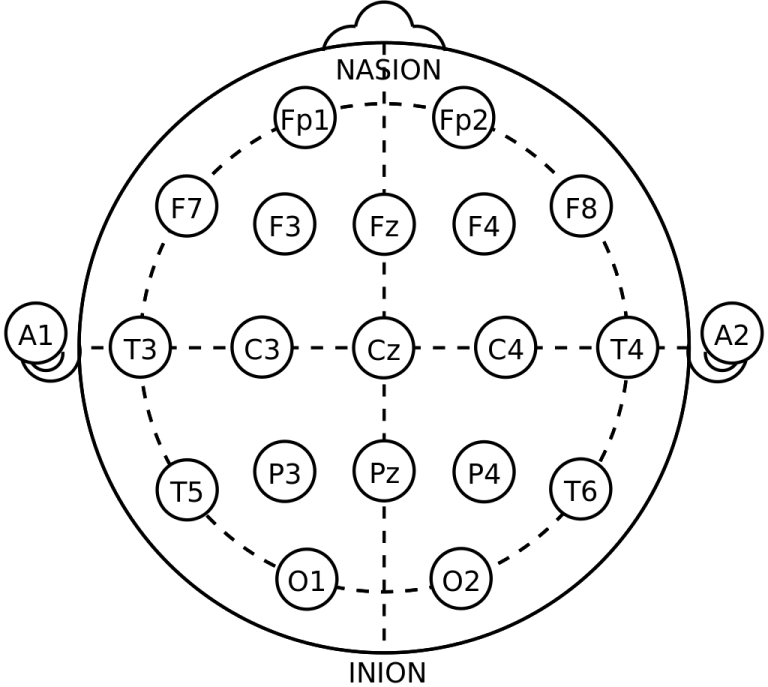
10–20 system
Once everything was connected, the LED would blink every time the user blinked, which made the system feel surprisingly real even though it was still very basic. The video below shows it working.
In the end, this project taught me that building a brain-computer interface is not just about wiring a few parts together. It is a mix of electronics, signal processing, experimentation, and a lot of patience.
Comments
Comment with your GitHub account.